A one-page report is generated for each class from which students' ratings have been collected.
The Instructor Report contains the text of each of the rating questions appearing on the questionnaire. The questions are reported in the sequence that they were printed on the questionnaire. If the question is a unique question, xxx is printed to indicate that the question is not catalogued.
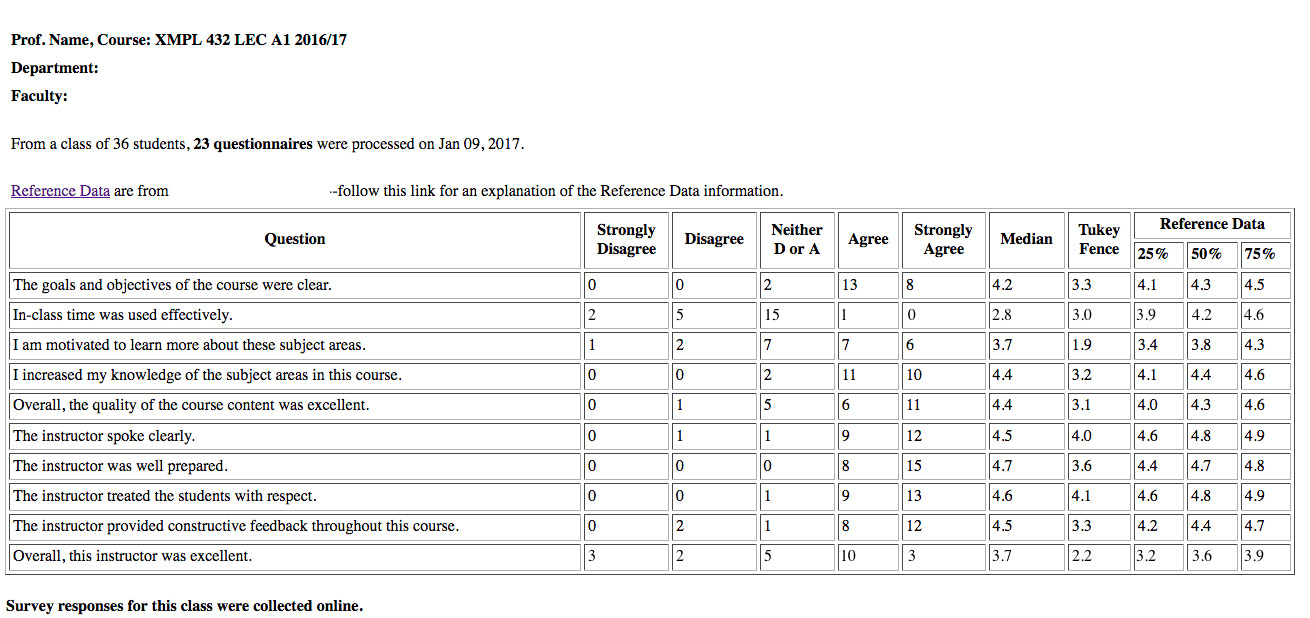
Following the text of each question, the numbers of students responding to the rating scale Strongly Disagree (SD), Disagree (D), Neutral (N), Agree (A), and Strongly Agree (SA) are reported. These frequencies are followed by the median rating of the responses.
For the catalogued questions, the median is followed by four reference data values based on Tukey's box-and-whisker plot analysis (John W. Tukey, Exploratory Data Analysis, Addison-Wesley Publishing Company, Inc. 1977).
Ratings from other classes are generally accumulated over a number of years in order to obtain a large enough sample to provide reasonably stable values for the reference data. If there has been insufficient usage of the question to generate the reference values, this will be indicated by the appearance of the text too few uses for rating. Reference data are not reported for unique questions even for those situations in which a large number of classes have requested the same unique (uncatalogued) question. The group from which the reference data are computed is indicated at the bottom of the report.
The reference values are provided to help you assess your medians in relation to those of your colleagues. In the example provided, the RANKS OF MEDIANS FROM OTHER CLASSES indicate that 25 percent of the classes rated on catalog-question "Overall, this instructor was excellent" obtained median ratings below 3.2; 50 percent of the classes were given median ratings below 3.6 and 75 percent of the classes were given median ratings below 3.9. Since 25% of the classes obtain medians above the 75th percentile and 25% obtain medians below the 25th percentile by definition, these values should not be used to determine whether a particular score is good or bad.
The column titled Tukey Fence refers to Tukey's inner fence statistic from his box-and-whisker values. It is computed as 1.5 times (75th percentile minus 25th percentile) which is then subtracted from the 25th percentile. (Please note that the numbers displayed have been rounded to one decimal point while the calculations use non-rounded numbers.) This value identifies a point below which scores (medians) may be considered outliers, i.e., scores which appear to be outside the usual distribution of scores for the reference group being tabulated. In the example below, the obtained median for catalog-question number "In-class time was used effectively" is 2.8 while the Tukey fence value is 3.0. In this case, an obtained median of 2.8 could be considered a low score relative to the reference group under consideration.
Please note that the precision of the instructor's median ratings is affected by the number of students responding to the question while the precision of the reference values is affected by the number of classes that have been rated on the particular question.
The IDQ system provides the option of generating additional copies of the Instructor Report for administrative purposes. Only the questions referenced in the associated block-id will be reported on these administrative copies.
The Aggregate Report, illustrated in the example, is presented in the same format as the Instructor Report. It is provided to accommodate aggregation of the responses from a number of classes into a single report. This option might be most appropriate for situations involving a number of sections within a course when a subset of questions focus on evaluating features associated with the course rather than those associated with individual instructors. Provided that the subset of questions have been requested via inclusion of the appropriate block-id on the IDQ Requisition form, it is possible for an administrator to request that the responses gathered from the various sections be aggregated into a single Aggregate Report.
There are two differences in presentation between this report and the Instructor Report.
- The tally of responses to the questions are presented as percentages rather than raw frequency counts.
- The option is provided for selecting the Reference Group to consist of only the individual classes which have been included in the aggregation for the report.
Please note that use of this last option will often produce a relatively small reference group resulting in unstable estimates of the quartile ranks (if the reference group does not consist of more than 15 classes, the message "too few uses" will appear rather than the desired reference data). When using this option, the information gleaned from the percentile ranks of the Reference Group medians is not so much concerned with indicating how the obtained median compares with medians from other classes but rather with indicating the variability of the medians of the classes which have been aggregated for inclusion in the report.
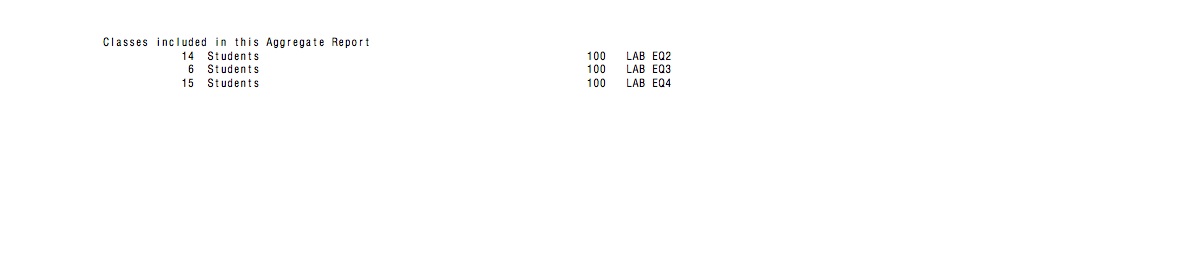
As indicated above, the Aggregate Report begins with a list describing the classes which have been included in the aggregation. The statistical report appears on the following page.
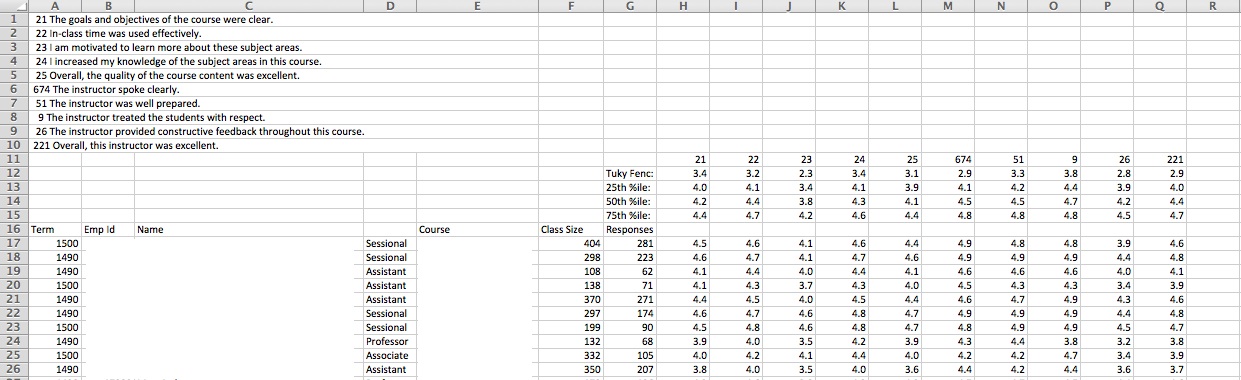
The Administrator's Summary, illustrated in the following example, is subject to the same constraints as the Aggregate Report concerning the need for a subset of questions to be associated with an appropriate block-id. It also allows for the possibility of restricting the Reference Group to only the classes which are listed in the given report.
The Administrator's Summary is provided in response to a request for a report which summarizes the results for a number of classes in a condensed format. As illustrated in the example, this is accomplished by reporting the results for each class on a single line with the medians for each question aligned in a column under the corresponding reference data. For convenience, an additional page is provided which indicates the text of the questions associated with each of the question numbers appearing in the main body of the report. A distinctive feature of the Administrator's Summary is that it shows in bold-face those medians which exceed the 75th percentile of the class medians in the Reference Group provided that the class median is computed from a minimum of 6 responses.
In addition to the printed copy of this report, a file may be requested which contains the data in a "tab-delimited" format which is suitable for importing into Microsoft Excel.